Aprs.fi Network tools
This is a section of the aprs.fi user guide.
Tools for network operators
The aprs.fi service has several features designed for APRS digipeater, igate and AIS receiver owners.
Heard statistics
aprs.fi collects statistics about the receiver coverage of each igate and digipeater. This feature (and it's deficiencies) are described earlier together with the info page. This data is also used for the following features.
Receiver range calculation
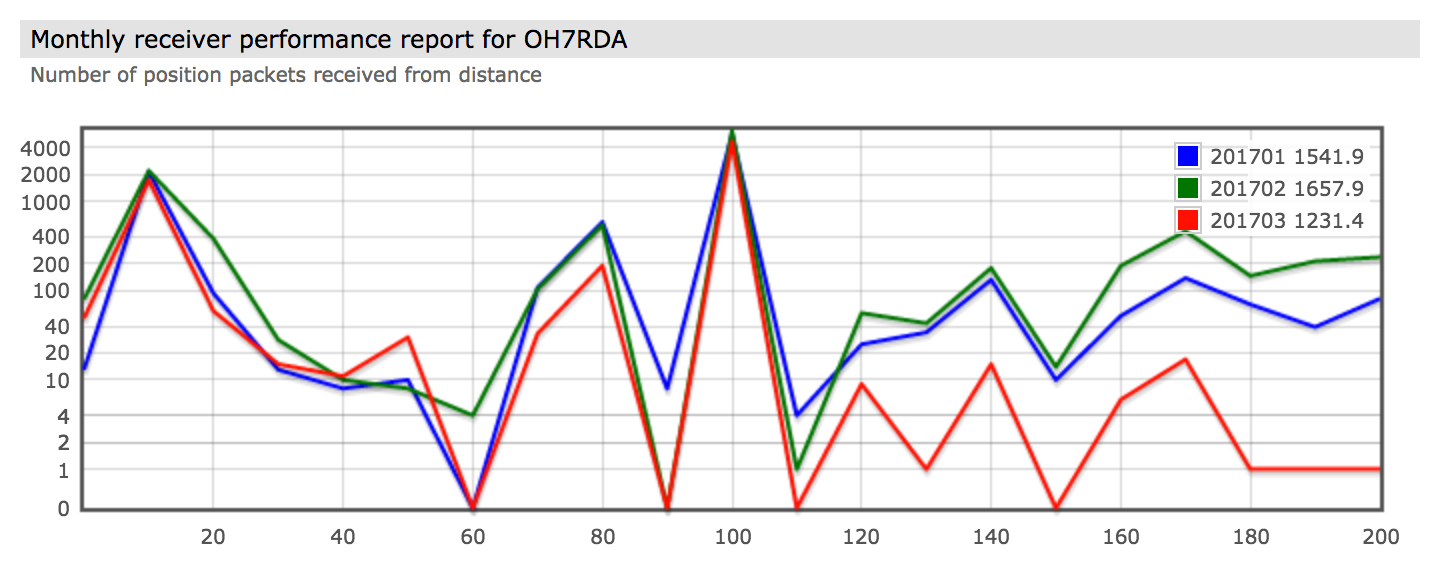
After a sufficient amount of packets have been determined to be received directly by an APRS igate or digipeater during a month, a normal receiver range is calculated. It is normally recalculated after every few hours. The range is displayed on the station's info page, and also plotted as a vertical line in the monthly receiver performance graph in the info graphs.
Normal receiver range estimate: 80 km (Updated: 2010-07-04 09:49:39 UTC)
This means that the station doesn't usually hear packets transmitted much farther than 80 km away. It does hear something from 80-90 km away, and maybe very rarely from much farther away. These statistics have 10 km resolution for up to 200 km, 100 km resolution until 2000 km and 500 km resolution from there on. A monthly receiver performance graph can be seen on the graphs page, with a dotted vertical line marking the estimated normal receiving range. The longest distances are usually caused by bad GPS fixes or corrupted packets.
The normal receiver range is updated every few hours when the receiver has directly heard at least 3000 packets during the month, so that the estimate is somewhat accurate. This causes the estimate to stop updating for the beginning of the month (until 3000 packets are heard).

Heard map
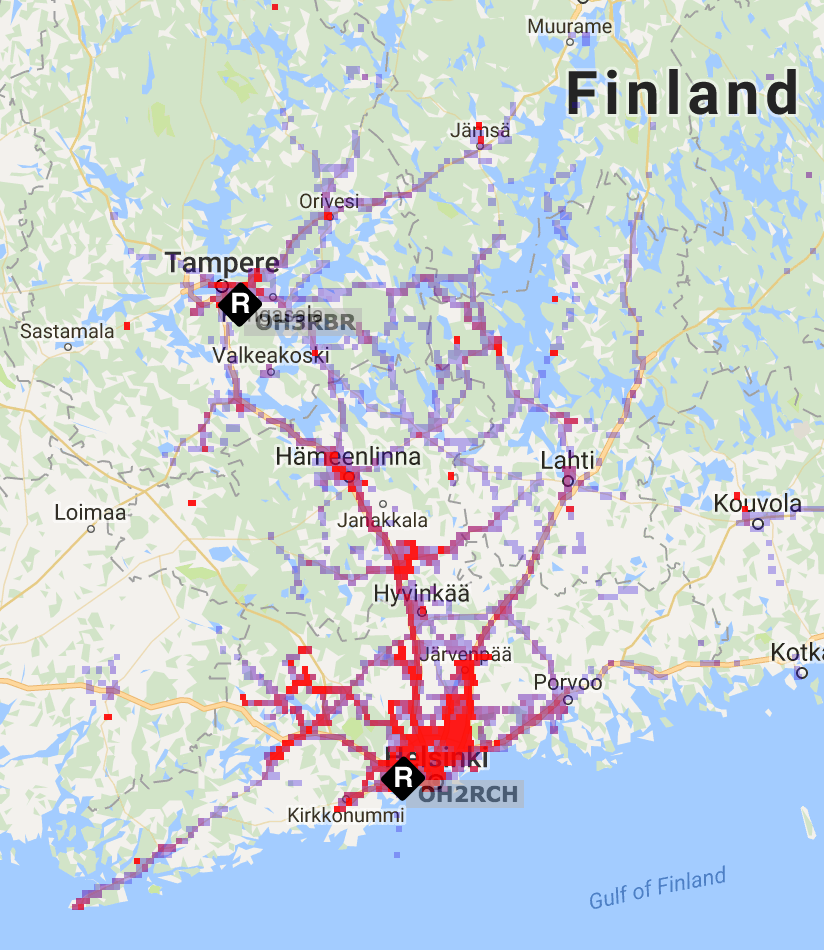
This map overlay illustrates the receiver coverage of an igate, digipeater or AIS receiver. It is not very accurate thanks to the APRS protocol and digipeater implementation issues described earlier, but it does give you some idea about the performance of each site.
Red colour indicates more position packets heard from the area, blue colour indicates less packets. Packets received during the current month are shown.
- OH2RCH is an igate with a pretty good coverage, thanks to it's 100-meter antenna tower.
It is also possible to view the combined coverage of two receivers:
Gated map
This map overlay illustrates the service area of an igate, together with the digipeaters in the area. The service area is generally much larger than the area where packets are received directly. Position packets which were gated by this igate during the current month are shown.
Like the Heard map, this view supports looking up multiple igates at the same time:

aprs.fi user guide